Welcome to irAE atlas
Citation: Lei Zhang, Xiaokai Fan, Jun Ma, Jun Zhang, Bin Hu, Di Zhou, Junjun Zhou, Xiumei Ma, Jianming Tang, Yongrui Bai, Haiyan Chen, Ying Jing. Distinct immune cell dynamics associated with immune-related adverse events during combined chemoradiation and immune checkpoint inhibitor therapy. Manuscript submitted.
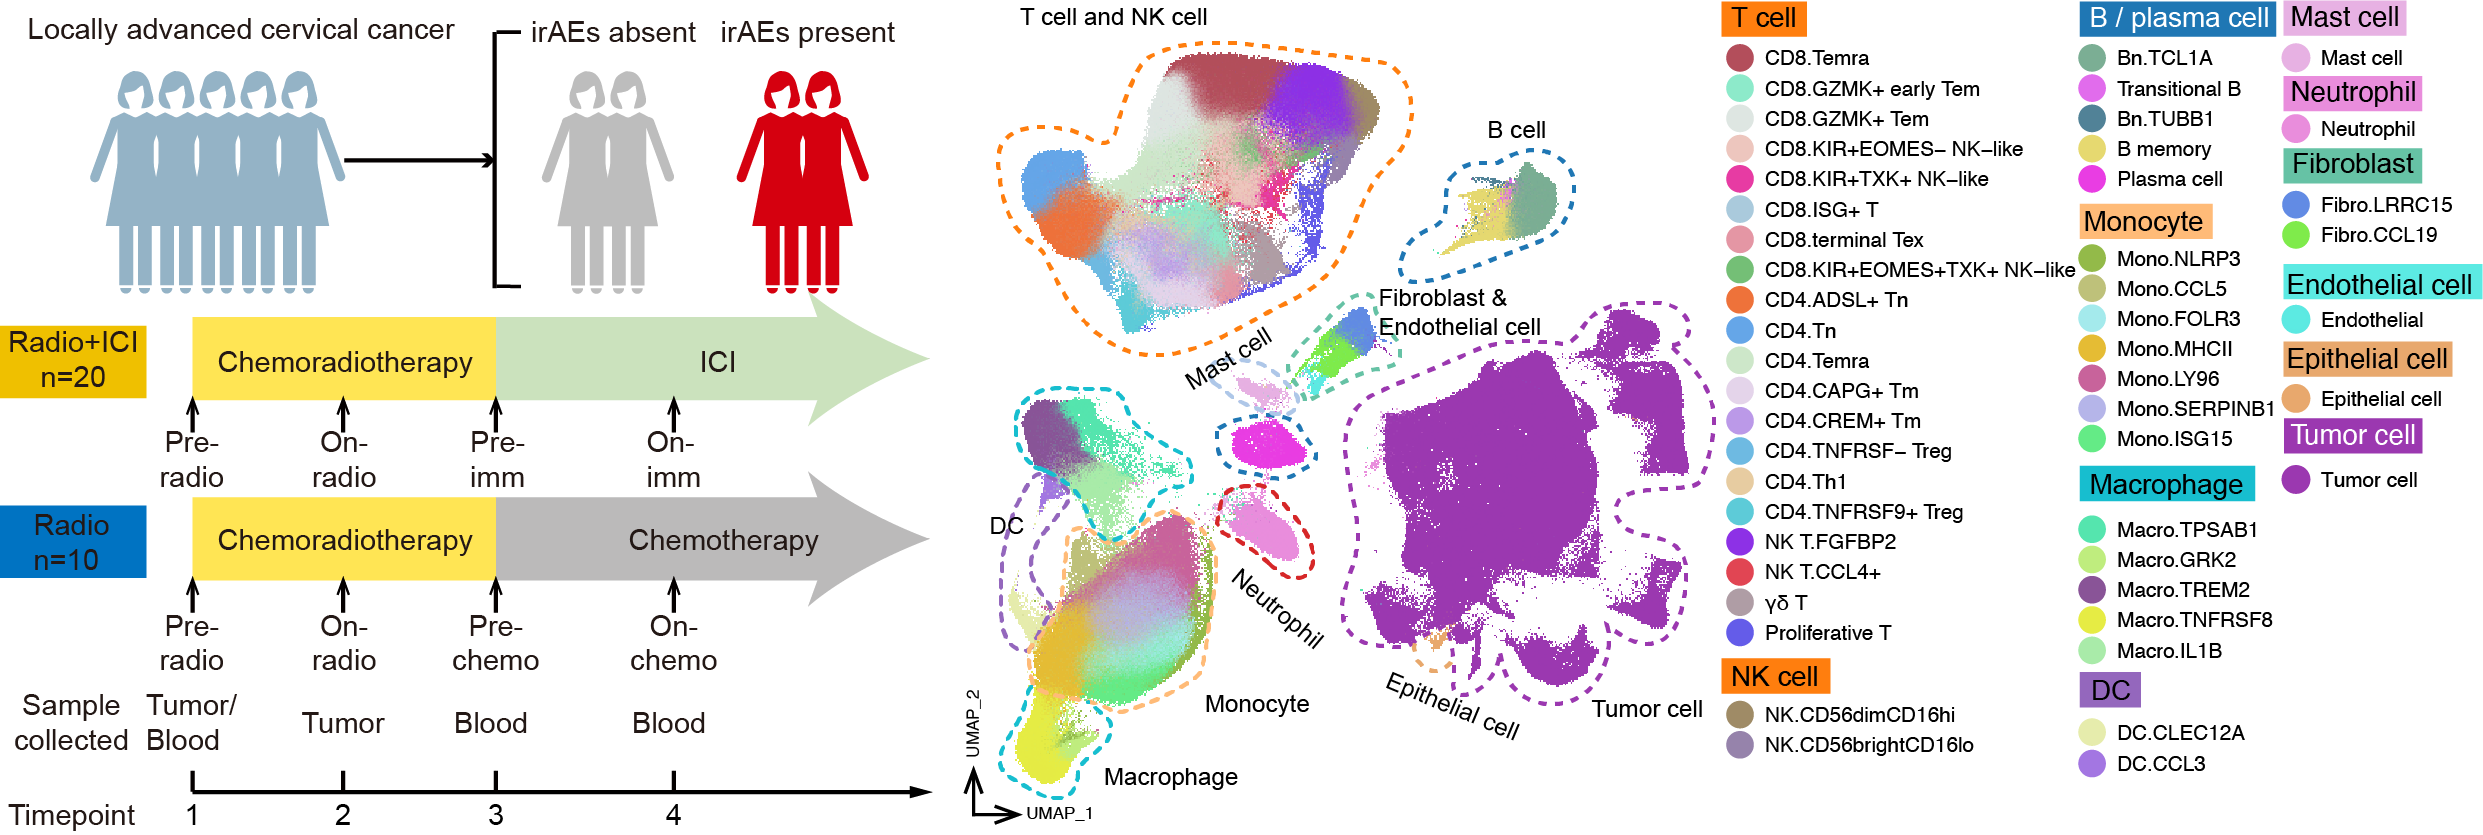
This data portal includes our dataset of locally advanced cervical cancer patient treated by chemoradiotherapy and immune checkpoint inhibitors and some public scRNA-seq datasets about irAEs. All data involving personal information has been anonymized. You can browse each dataset and calculate predicted irAE score of your own data.
Cohort details
The data may take a few minutes to load.
Gene expression
Selected cell distribution & cell proportion
Input your sentences & select model
The calculation may take a few minutes. To reduce server load and minimize your waiting time, kindly limit each submission to a maximum of ten samples.
1. Prepare your file. You can download an example file by clicking the “Demo” button.
1)Your file should be in a tab-delimited input format (.txt) with no quotation marks and no missing data entries.
2)Column 1 should contain the names of your samples or cells. The name for column 1 is “barcode”. Column 2 should contain the sentences generated for each cell or sample, as explained in next step. The name for column 2 is “sentence”.
3) Rank the genes based on raw counts, retain the top 260 genes, and create a sentence according to the names of top 260 genes, ordered by their ranks. Ensure that the gene names in each sentence are separate by spaces.
2. Upload your file. Click ”Browse” button and select the prepared “.txt” file from your device.
3. Choose the model that best fits your study, and click “Submit” button.
4. The results generated here are relative distance to the irAE cells. You need to normalize the data within your dataset to obtain predicted irAE score using this formula:
$$s_{i}=1-\frac{d_{i}-\min(d)}{\max (d)-\min(d)}$$
Where :
\(s_{i}\) is the predicted irAE score for cell or sample \(i\)
\(d_{i}\) represents the relative distance of cell or sample \(i\) calculated here
\(min(d)\) is the minimum distance in the entire dataset,
\(max(d)\) is the maximum distance in the entire dataset.

Greater Bay Area Institute of Precision Medicine (Guangzhou)
School of Life Sciences, Fudan University
Email: jingying@ipm-gba.org.cn
